Visualising our Open Data

Syngenta is committed to developing and demonstrating the safety and benefits of RNA-based biocontrols in a transparent manner. To support this, we have released experiment data as open data. We encourage you to download and explore the data yourselves but have provided some visual representations to allow you to take an interactive look.

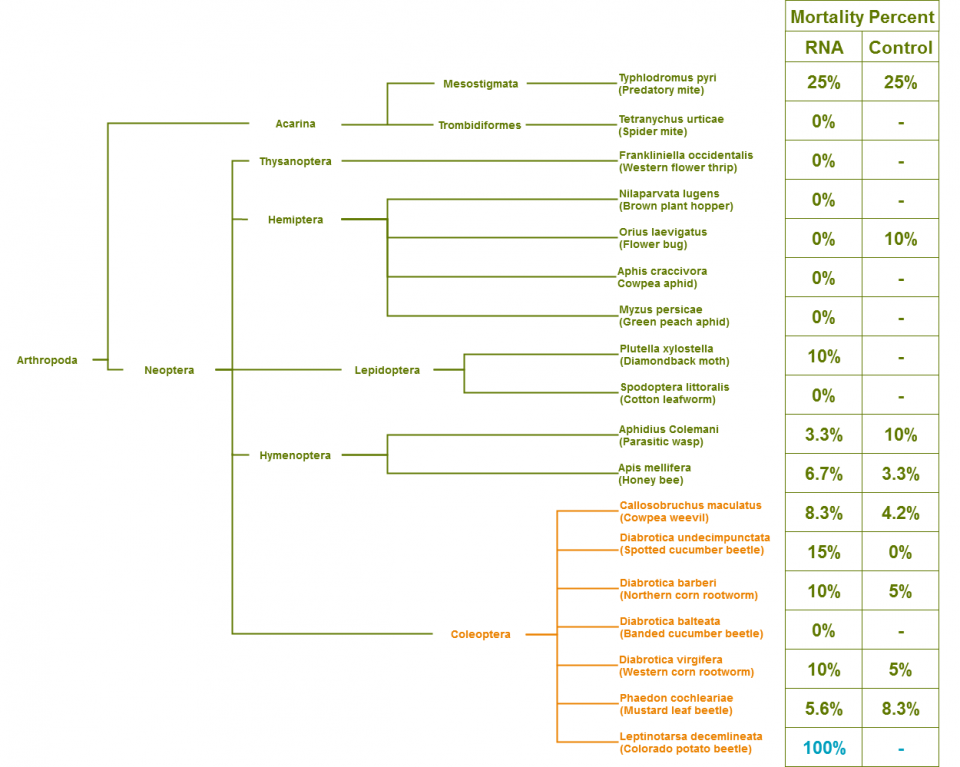
This tree shows the taxonomic relationship between all the species included in the open data release. It compares the highest observed mortality rates per species exposed to the RNA-based biocontrol to their control samples (RNA-based biocontrol mortality is the left number and control mortality is the right number; in certain instances a control was not included in the experiment and is therefore represented as -). Exploring the data, it can be seen that other species are unharmed when exposed to the Colorado Potato Beetle (CPB) RNA-based biocontrol, even those that are closely related.

In the chart below, we have focused on the branches of the tree closest to the Colorado Potato Beetle (Leptinotarsa decemlineata).The graphs show that those species that are closely related to CPB are unaffected by the CPB RNA-based biocontrol. A significant observation is that even when closely related species are exposed to rates that are 400 times higher than a rate that controls the Colorado Potato Beetle they appear unaffected.

{"queryState":{"size":100,"from":0,"q":"","facets":{},"filters":[]},"step":3,"source":{"backend":"csv","url":"http://opendata.syngenta.agroknow.com/sites/default/files/data_for_cpb_chart1_latest5.csv"},"model":{"backend":"csv","url":"http://opendata.syngenta.agroknow.com/sites/default/files/data_for_cpb_chart1_latest5.csv"},"fields":[{"name":"Species","value":"Species","selected":false},{"name":"Control","value":"Control","selected":true},{"name":"Lead Construct","value":"Lead Construct","selected":true}],"yDataTypes":[{"name":"Number","value":"Number","selected":true},{"name":"String","value":"String","selected":false},{"name":"Date","value":"Date","selected":false},{"name":"Auto","value":"Auto","selected":false}],"xfields":[{"name":"Species","value":"Species","selected":true},{"name":"Control","value":"Control","selected":false},{"name":"Lead Construct","value":"Lead Construct","selected":false}],"xDataTypes":[{"name":"Number","value":"Number","selected":false},{"name":"String","value":"String","selected":true},{"name":"Date","value":"Date","selected":false},{"name":"Auto","value":"Auto","selected":false}],"seriesFields":["Control","Lead Construct"],"yDataType":"Number","xfield":"Species","xDataType":"String","graphTypes":[{"value":"discreteBarChart","selected":false},{"value":"multiBarChart","selected":true},{"value":"multiBarHorizontalChart","selected":false},{"value":"stackedAreaChart","selected":false},{"value":"pieChart","selected":false},{"value":"lineChart","selected":false},{"value":"lineWithFocusChart","selected":false},{"value":"scatterChart","selected":false},{"value":"linePlusBarChart","selected":false}],"graphType":"multiBarChart","width":640,"height":480,"group":false,"computeXLabels":false,"options":{"reduceXTicks":false,"tooltips":false,"margin":{"top":30,"right":20,"bottom":300,"left":200},"xAxis":{"rotateLabels":-45,"axisLabel":"Species","axisLabelDistance":0},"yAxis":{"axisLabel":"Mortality Rate (%)","axisLabelDistance":0},"y1Axis":{"axisLabelDistance":0},"y2Axis":{"axisLabelDistance":0},"showControls":false,"showLegend":true,"showValues":false,"staggerLabels":false,"color":["#EB8200","#00A0BE"],"stacked":false},"sortFields":[{"name":"default","label":"Default","selected":false},{"name":"Species","value":"Species","selected":false},{"name":"Control","value":"Control","selected":false},{"name":"Lead Construct","value":"Lead Construct","selected":false}],"errors":{},"chartHeight":"700","xFormat":{"type":"String","format":""},"yFormat":{"type":"String","format":""},"y1Format":{"type":null},"y2Format":{"type":null},"sort":"","showTitle":false,"xValues":["",""],"xValuesFrom":"","xValuesTo":"","xValuesStep":1,"yValues":[0,100],"yValuesFrom":"0","yValuesTo":"100","yValuesStep":20,"y1Values":[null,null],"y1ValuesStep":1,"y2Values":[null,null],"y2ValuesStep":1,"goal":{"value":"","color":"","outside":false,"label":true}}
Top of Page