In this section Close
Visualising our Open Data
Syngenta is committed to developing and demonstrating the safety and benefits of RNA-based biocontrols in a transparent manner. To support this, we have released experiment data as open data. We encourage you to download and explore the data yourselves but have provided some visual representations to allow you to take an interactive look.
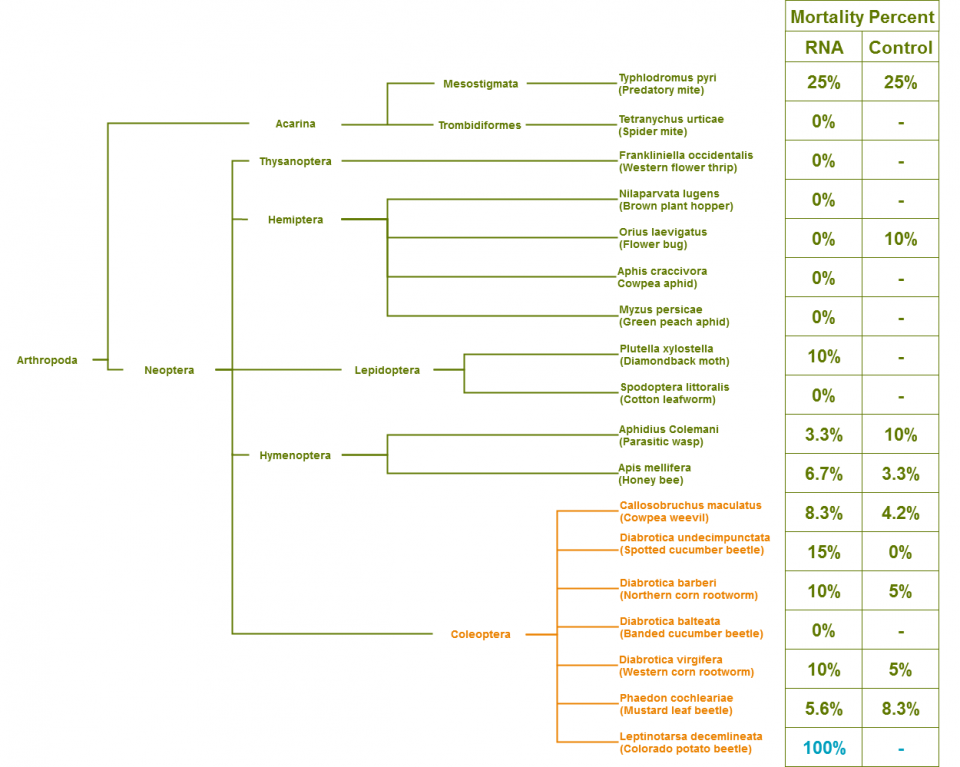
This tree shows the taxonomic relationship between all the species included in the open data release. It compares the highest observed mortality rates per species exposed to the RNA-based biocontrol to their control samples (RNA-based biocontrol mortality is the left number and control mortality is the right number; in certain instances a control was not included in the experiment and is therefore represented as -). Exploring the data, it can be seen that other species are unharmed when exposed to the Colorado Potato Beetle (CPB) RNA-based biocontrol, even those that are closely related.

In the chart below, we have focused on the branches of the tree closest to the Colorado Potato Beetle (Leptinotarsa decemlineata).The graphs show that those species that are closely related to CPB are unaffected by the CPB RNA-based biocontrol. A significant observation is that even when closely related species are exposed to rates that are 400 times higher than a rate that controls the Colorado Potato Beetle they appear unaffected.
{"queryState":{"size":100,"from":0,"q":"","facets":{},"filters":[]},"step":3,"source":{"backend":"csv","url":"http://opendata.syngenta.agroknow.com/sites/default/files/data_for_cpb_chart1_latest5.csv"},"model":{"backend":"csv","url":"http://opendata.syngenta.agroknow.com/sites/default/files/data_for_cpb_chart1_latest5.csv"},"fields":[{"name":"Species","value":"Species","selected":false},{"name":"Control","value":"Control","selected":true},{"name":"Lead Construct","value":"Lead Construct","selected":true}],"yDataTypes":[{"name":"Number","value":"Number","selected":true},{"name":"String","value":"String","selected":false},{"name":"Date","value":"Date","selected":false},{"name":"Auto","value":"Auto","selected":false}],"xfields":[{"name":"Species","value":"Species","selected":true},{"name":"Control","value":"Control","selected":false},{"name":"Lead Construct","value":"Lead Construct","selected":false}],"xDataTypes":[{"name":"Number","value":"Number","selected":false},{"name":"String","value":"String","selected":true},{"name":"Date","value":"Date","selected":false},{"name":"Auto","value":"Auto","selected":false}],"seriesFields":["Control","Lead Construct"],"yDataType":"Number","xfield":"Species","xDataType":"String","graphTypes":[{"value":"discreteBarChart","selected":false},{"value":"multiBarChart","selected":true},{"value":"multiBarHorizontalChart","selected":false},{"value":"stackedAreaChart","selected":false},{"value":"pieChart","selected":false},{"value":"lineChart","selected":false},{"value":"lineWithFocusChart","selected":false},{"value":"scatterChart","selected":false},{"value":"linePlusBarChart","selected":false}],"graphType":"multiBarChart","width":640,"height":480,"group":false,"computeXLabels":false,"options":{"reduceXTicks":false,"tooltips":false,"margin":{"top":30,"right":20,"bottom":300,"left":200},"xAxis":{"rotateLabels":-45,"axisLabel":"Species","axisLabelDistance":0},"yAxis":{"axisLabel":"Mortality Rate (%)","axisLabelDistance":0},"y1Axis":{"axisLabelDistance":0},"y2Axis":{"axisLabelDistance":0},"showControls":false,"showLegend":true,"showValues":false,"staggerLabels":false,"color":["#EB8200","#00A0BE"],"stacked":false},"sortFields":[{"name":"default","label":"Default","selected":false},{"name":"Species","value":"Species","selected":false},{"name":"Control","value":"Control","selected":false},{"name":"Lead Construct","value":"Lead Construct","selected":false}],"errors":{},"chartHeight":"700","xFormat":{"type":"String","format":""},"yFormat":{"type":"String","format":""},"y1Format":{"type":null},"y2Format":{"type":null},"sort":"","showTitle":false,"xValues":["",""],"xValuesFrom":"","xValuesTo":"","xValuesStep":1,"yValues":[0,100],"yValuesFrom":"0","yValuesTo":"100","yValuesStep":20,"y1Values":[null,null],"y1ValuesStep":1,"y2Values":[null,null],"y2ValuesStep":1,"goal":{"value":"","color":"","outside":false,"label":true}}
How to understand the graph
- Each individual chart relates to a different rate of the RNA-based biocontrol. The rates increase from left to right and the left-most chart is the control group (no RNA-based biocontrol applied).
- The heights of the bars show what percentage of insects were dead at the end of the experiment.
- The individual bars are each species type.
This barchart shows how various beneficial species responded to exposure to the RNA biocontrol at different rates. Exploring the data, it can be seen that species we wish to protect are unharmed when exposed to the Colorado Potato Beetle RNA biocontrol.
{"queryState":{"size":100,"from":0,"q":"","facets":{},"filters":[]},"step":3,"source":{"backend":"csv","url":"http://opendata.syngenta.agroknow.com/sites/default/files/RNAi_LeadConstructNoCheck7.csv"},"model":{"backend":"csv","url":"//opendata.syngenta.agroknow.com/sites/default/files/RNAi_LeadConstructNoCheck7.csv"},"fields":[{"name":"ppmAI","value":"ppmAI","selected":false},{"name":"Aphidius colemani (Parasitic wasp)","value":"Aphidius colemani (Parasitic wasp)","selected":true},{"name":"Orius laevigatus (Flower bug)","value":"Orius laevigatus (Flower bug)","selected":true},{"name":"Typhlodromus pyri (Predatory mite)","value":"Typhlodromus pyri (Predatory mite)","selected":true}],"yDataTypes":[{"name":"Number","value":"Number","selected":false},{"name":"String","value":"String","selected":true},{"name":"Date","value":"Date","selected":false},{"name":"Auto","value":"Auto","selected":false}],"xfields":[{"name":"ppmAI","value":"ppmAI","selected":true},{"name":"Aphidius colemani (Parasitic wasp)","value":"Aphidius colemani (Parasitic wasp)","selected":false},{"name":"Orius laevigatus (Flower bug)","value":"Orius laevigatus (Flower bug)","selected":false},{"name":"Typhlodromus pyri (Predatory mite)","value":"Typhlodromus pyri (Predatory mite)","selected":false}],"xDataTypes":[{"name":"Number","value":"Number","selected":false},{"name":"String","value":"String","selected":true},{"name":"Date","value":"Date","selected":false},{"name":"Auto","value":"Auto","selected":false}],"seriesFields":["Aphidius colemani (Parasitic wasp)","Orius laevigatus (Flower bug)","Typhlodromus pyri (Predatory mite)"],"yDataType":"String","xfield":"ppmAI","xDataType":"String","graphTypes":[{"value":"discreteBarChart","selected":false},{"value":"multiBarChart","selected":true},{"value":"multiBarHorizontalChart","selected":false},{"value":"stackedAreaChart","selected":false},{"value":"pieChart","selected":false},{"value":"lineChart","selected":false},{"value":"lineWithFocusChart","selected":false},{"value":"scatterChart","selected":false},{"value":"linePlusBarChart","selected":false}],"graphType":"multiBarChart","width":640,"height":480,"group":false,"computeXLabels":false,"options":{"reduceXTicks":false,"tooltips":true,"margin":{"top":60,"right":20,"bottom":40,"left":60},"xAxis":{"rotateLabels":0,"axisLabel":"RNA-based Biocontrol (ppm of AI)","axisLabelDistance":0},"yAxis":{"axisLabel":"Survival Rate (%)","axisLabelDistance":-10},"y1Axis":{"axisLabelDistance":0},"y2Axis":{"axisLabelDistance":0},"showControls":false,"showLegend":true,"staggerLabels":false,"stacked":false,"color":["#EB8200","#00A0BE","#5F7800"]},"sortFields":[{"name":"default","label":"Default","selected":false},{"name":"ppmAI","value":"ppmAI","selected":true},{"name":"Aphidius colemani (Parasitic wasp)","value":"Aphidius colemani (Parasitic wasp)","selected":false},{"name":"Orius laevigatus (Flower bug)","value":"Orius laevigatus (Flower bug)","selected":false},{"name":"Typhlodromus pyri (Predatory mite)","value":"Typhlodromus pyri (Predatory mite)","selected":false}],"errors":{},"chartHeight":"600","xFormat":{"type":"String","format":""},"yFormat":{"type":"String","format":""},"y1Format":{"type":null},"y2Format":{"type":null},"sort":"ppmAI","showTitle":false,"xValues":["",""],"xValuesFrom":"","xValuesTo":"","xValuesStep":1,"yValues":["0","100"],"yValuesFrom":"0","yValuesTo":"100","yValuesStep":20,"y1Values":[null,null],"y1ValuesStep":1,"y2Values":[null,null],"y2ValuesStep":1,"goal":{"value":"","color":"","outside":false,"label":false}}
How to understand the graph
- Each individual chart relates to a different type of treatment to which the insects were exposed.
- The heights of the bars show what percentage of insects were still alive at the end of the experiment.
- The bars are grouped by the concentration of treatment the insects were exposed to. This is measured by ‘parts per million (ppm) of active ingredient’ and the highest concentration is even more than twice the standard field rate. This is a way of expressing very dilute concentrations of substances. Just as percent means out of a hundred, so parts per million or ppm means out of a million.
- The individual bars are each species type.
- Click the buttons at the top of the graph to filter the data
Once again, the barcharts below show how the species responded to exposure to the CPB RNA-based biocontrol, although in this instance the species are considered to be crop pests.
The CPB RNA-based biocontrol is so selective that, even at twice the standard rate, only the intended pest is affected.
{"queryState":{"size":100,"from":0,"q":"","facets":{},"filters":[]},"step":3,"source":{"backend":"csv","url":"http://opendata.syngenta.agroknow.com/sites/default/files/Other_Crop_Pests_.Untargeted3.csv"},"model":{"backend":"csv","url":"//opendata.syngenta.agroknow.com/sites/default/files/Other_Crop_Pests_.Untargeted3.csv"},"fields":[{"name":"Rate","value":"Rate","selected":false},{"name":"Aphis craccivora (Cowpea aphid)","value":"Aphis craccivora (Cowpea aphid)","selected":true},{"name":"Frankliniella occidentalis (Western flower thrip)","value":"Frankliniella occidentalis (Western flower thrip)","selected":true},{"name":"Myzus persicae (Green peach aphid)","value":"Myzus persicae (Green peach aphid)","selected":true},{"name":"Nilaparvata lugens (Brown plant hopper)","value":"Nilaparvata lugens (Brown plant hopper)","selected":true},{"name":"Plutella xylostella (Diamondback moth)","value":"Plutella xylostella (Diamondback moth)","selected":true},{"name":"Spodoptera littoralis (Cotton leafworm)","value":"Spodoptera littoralis (Cotton leafworm)","selected":true},{"name":"Tetranychus urticae (Spider mite)","value":"Tetranychus urticae (Spider mite)","selected":true}],"yDataTypes":[{"name":"Number","value":"Number","selected":false},{"name":"String","value":"String","selected":false},{"name":"Date","value":"Date","selected":false},{"name":"Auto","value":"Auto","selected":true}],"xfields":[{"name":"Rate","value":"Rate","selected":true},{"name":"Aphis craccivora (Cowpea aphid)","value":"Aphis craccivora (Cowpea aphid)","selected":false},{"name":"Frankliniella occidentalis (Western flower thrip)","value":"Frankliniella occidentalis (Western flower thrip)","selected":false},{"name":"Myzus persicae (Green peach aphid)","value":"Myzus persicae (Green peach aphid)","selected":false},{"name":"Nilaparvata lugens (Brown plant hopper)","value":"Nilaparvata lugens (Brown plant hopper)","selected":false},{"name":"Plutella xylostella (Diamondback moth)","value":"Plutella xylostella (Diamondback moth)","selected":false},{"name":"Spodoptera littoralis (Cotton leafworm)","value":"Spodoptera littoralis (Cotton leafworm)","selected":false},{"name":"Tetranychus urticae (Spider mite)","value":"Tetranychus urticae (Spider mite)","selected":false}],"xDataTypes":[{"name":"Number","value":"Number","selected":false},{"name":"String","value":"String","selected":true},{"name":"Date","value":"Date","selected":false},{"name":"Auto","value":"Auto","selected":false}],"seriesFields":["Aphis craccivora (Cowpea aphid)","Frankliniella occidentalis (Western flower thrip)","Myzus persicae (Green peach aphid)","Nilaparvata lugens (Brown plant hopper)","Plutella xylostella (Diamondback moth)","Spodoptera littoralis (Cotton leafworm)","Tetranychus urticae (Spider mite)"],"yDataType":"Auto","xfield":"Rate","xDataType":"String","graphTypes":[{"value":"discreteBarChart","selected":false},{"value":"multiBarChart","selected":true},{"value":"multiBarHorizontalChart","selected":false},{"value":"stackedAreaChart","selected":false},{"value":"pieChart","selected":false},{"value":"lineChart","selected":false},{"value":"lineWithFocusChart","selected":false},{"value":"scatterChart","selected":false},{"value":"linePlusBarChart","selected":false}],"graphType":"multiBarChart","width":640,"height":480,"group":false,"computeXLabels":false,"options":{"reduceXTicks":true,"tooltips":true,"margin":{"top":100,"right":20,"bottom":80,"left":60},"xAxis":{"rotateLabels":0,"axisLabel":"Treatment Rate","axisLabelDistance":0},"yAxis":{"axisLabel":"Survival Rate (%)","axisLabelDistance":0},"y1Axis":{"axisLabelDistance":0},"y2Axis":{"axisLabelDistance":0},"showControls":false,"showLegend":true,"staggerLabels":false,"stacked":false,"color":["#FFB400","#EB8200","#82C8DC","#00A0BE","#AAb400","#5F7800"]},"sortFields":[{"name":"default","label":"Default","selected":false},{"name":"Rate","value":"Rate","selected":false},{"name":"Aphis craccivora (Cowpea aphid)","value":"Aphis craccivora (Cowpea aphid)","selected":false},{"name":"Frankliniella occidentalis (Western flower thrip)","value":"Frankliniella occidentalis (Western flower thrip)","selected":false},{"name":"Myzus persicae (Green peach aphid)","value":"Myzus persicae (Green peach aphid)","selected":false},{"name":"Nilaparvata lugens (Brown plant hopper)","value":"Nilaparvata lugens (Brown plant hopper)","selected":false},{"name":"Plutella xylostella (Diamondback moth)","value":"Plutella xylostella (Diamondback moth)","selected":false},{"name":"Spodoptera littoralis (Cotton leafworm)","value":"Spodoptera littoralis (Cotton leafworm)","selected":false},{"name":"Tetranychus urticae (Spider mite)","value":"Tetranychus urticae (Spider mite)","selected":false}],"errors":{},"chartHeight":"","xFormat":{"type":"String","format":""},"yFormat":{"type":"String","format":""},"y1Format":{"type":null},"y2Format":{"type":null},"sort":"","showTitle":true,"xValues":["",""],"xValuesFrom":"","xValuesTo":"","xValuesStep":1,"yValues":["0","100"],"yValuesFrom":"0","yValuesTo":"100","yValuesStep":20,"y1Values":[null,null],"y1ValuesStep":1,"y2Values":[null,null],"y2ValuesStep":1,"goal":{"value":"","color":"","outside":false,"label":false}}
How to understand the graph
- The left-hand chart relates to insects exposed to the RNA-based biocontrol at the standard rate. In the right-hand chart the rate has been doubled.
- The heights of the bars show what percentage of insects were still alive at the end of the experiment.
- The individual bars are each species type.
- Click the buttons at the top of the graph to filter the data
